

Logs, Usage & Tracing
Every request through the proxy produces a log row, a usage record, and — when it is an administrative or security event — a tamper-evident audit entry.
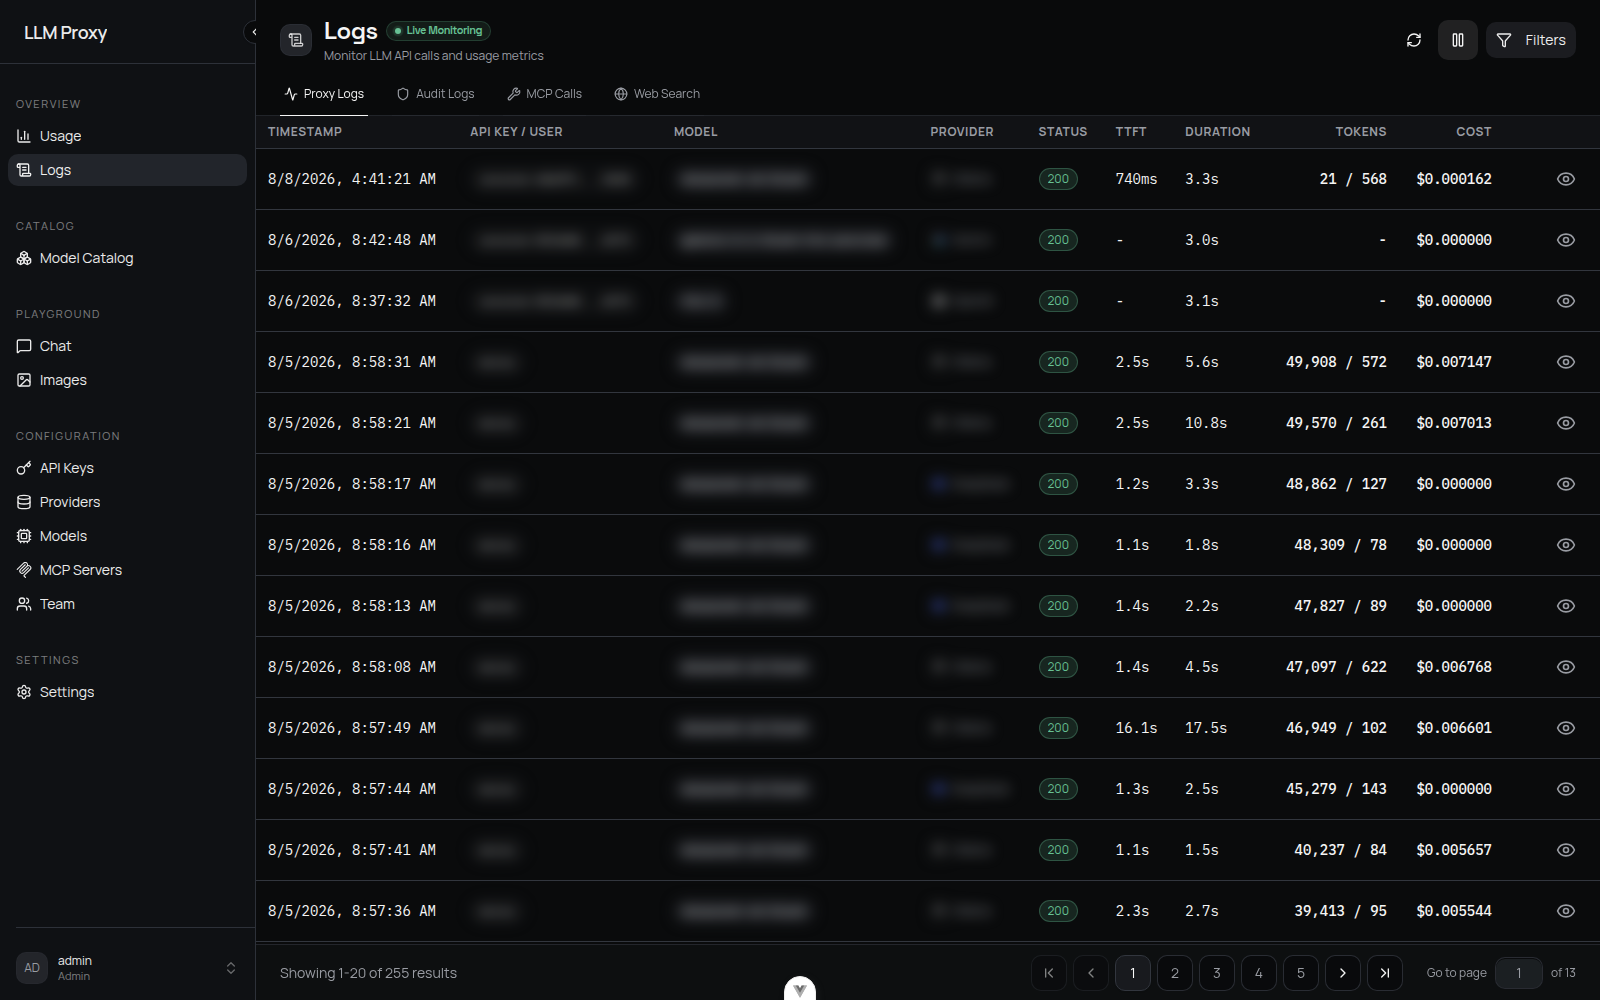
Proxy Logs
Logs → Proxy Logs lists one row per request with timestamp, key/user, model, provider, status, TTFT, duration, tokens, and cost. Open a row for the full request and response bodies, headers, retry/fallback details, and (for smart-routed requests) the routing decision.
| Field | Notes |
|---|---|
status_code | Upstream or proxy status. 499 means the client disconnected mid-request and the upstream call was cancelled |
ttft_ms | Time to first token (streaming) |
response_time_ms | Total duration |
| Token counts | Prompt, completion, total; cache creation/read; cached prompt; audio in/out |
cost_usd / cache_savings_usd | Billed cost and the estimated saving from cache reads |
log_metadata | fallback_attempts/fallback_count/fallback_providers, retry_attempts/retry_count, routing fields, provider_model_name |
client_ip, user_agent, auth_method | Attribution, computed through trusted-proxy resolution |
| Bodies | JSON, or {"$binary": true, "size": N} for binary payloads. Streaming responses are reassembled into the protocol's non-streaming JSON unless Log Raw Stream is on |
Filtering (GET /api/logs): page or cursor pagination (max 200 per page), free-text search, date range, exact status or status range, model, provider, user, API key, endpoint, and log type. Non-admins are automatically scoped to their own rows.
Privacy controls
Configured in Settings → Log Management:
- Bodies (
log_input_output, default off) is the master switch for persisting request/response bodies. Off, every row is still written (status, tokens, cost, routing, audit metadata, and headers) but every content payload is replaced by{"_bodies_disabled": true}: the request and response bodies, upstream error bodies and messages (error_details.response_body/original_error/detail, plus the error text recorded in each fallback/retry attempt), and MCP arguments/results and web-search queries/results inlog_metadata. It is the master switch, not a sampling knob:x-log-full: truecannot re-enable bodies for one request — turn it on in Settings → Log Management (and back off when done) to inspect payloads. The row's free-texterror_messageanderror_stack_tracecolumns are kept: they are the diagnostic reason (rate limit vs budget vs upstream failure) and the rejection rows below depend on that text. The upstream error payload they can echo lives inlog_metadata.error_details, which is scrubbed. - Sampling (
sampling_rate, default 1.0) limits body capture for requests that do have bodies enabled: sampled-out bodies are stored as{"_sampled_out": true}(a distinct marker, so the UI never reports "sampled out" when bodies are simply disabled) while metadata is still recorded.x-log-full: trueforces full capture for one request. - Raw stream (
log_raw_stream, default off) controls how a streaming response is stored. Off, the accumulated content blocks are reassembled through the protocol serializer into the exact JSON a non-streaming call would have returned — the SSE envelope (id,model,object,choices[0].index, …) repeats on every delta, so the reassembled body is an order of magnitude smaller, and unlike the SSE text it is maskable and searchable. Measured on representative streams: ~45× smaller for Chat Completions, ~20× for Anthropic. On, the raw SSE frames are stored verbatim as a string.x-log-full: trueforces raw for one request. The native-passthrough tier (the default for OpenAI-compatible providers on theopenaiprotocol, and for Anthropic/OpenResponses-native providers) forwards upstream frames without running the content transformer. It still logs the reassembled body — each protocol rebuilds it from its own frames: native Chat Completions frames arechat.completion.chunkpayloads, native Anthropic frames rebuild the message block by block, and a native Responses stream carries the whole response on its terminal event. Raw frames are kept only where there is no way to rebuild the body: a native tier whose protocol transformer cannot, and the generic streams (image generation and edit) whose payloads carry no content model. A stream whose body cannot be rebuilt stores{"streaming": true, "_assembled": false}, and nothing is stored when the request was sampled out orlog_input_outputis off. - Body cap (
max_logged_body_bytes, default1048576= 1 MiB;0= unlimited) limits body size at write time: a request or response body bigger than the cap is stored as{"_truncated": true, "size": N}(the original serialized size in bytes) instead of the payload. Since the cap is applied when the log row is built, it also truncates requests that forced capture withx-log-full: true; metadata is always recorded. - Masking (
mask_sensitive_data, default on) replaces credentials in headers, bodies, and MCP/tool arguments. Values ≤ 8 chars become***; longer values keep their first 3 and last 4 characters. Add your own field names via Extra Sensitive Keys. - Retention (
log_retention_days, default 30;0= forever) is enforced by a sweep per log type that runs once a day. The sweep deletes in bounded batches, looping until exhausted — including request logs and usage records — so it never holds a single long write lock on a large store. A sweep that deleted rows is followed by a boundedPRAGMA incremental_vacuumandPRAGMA wal_checkpoint(TRUNCATE), trimming the WAL and reusing freed pages on SQLite databases created withauto_vacuum=INCREMENTAL; existing database files keep their mode and reclaim space only via a one-timeVACUUM(see Databases). Audit retention can be set separately.
Rejected requests
Requests rejected before the pipeline still leave a row, so an API key whose traffic is being refused is not invisible in Logs:
- Invalid API keys and IP lockouts are recorded as AUDIT rows by the auth middleware.
- Per-key rate limits (429), budget caps (429/503) and model restrictions (403) are recorded too. These rows carry the status and reason but deliberately no body: they are the path a client can trigger cheaply, so they must not become a write amplifier for prompt content. Repeated rejections for the same key and status are collapsed into one row per short window, so a client stuck in a retry loop cannot flood the log either; the collapsed attempts are reported in that row's metadata as
suppressed_since_last. The window is per worker, so a multi-worker deployment can write up to one row per worker per window. - Headers are kept on body-less rows (they are masked metadata), so a rejected or body-less request stays diagnosable.
Durability
Logs and usage are written through in-process queues with background batch writers. A full queue drops records (audit writes log an error instead); write failures retry with backoff and open a breaker after 5 consecutive failures. On shutdown the queues are drained (bounded at 5 s). Audit rows use a dedicated writer so endpoint traffic cannot crowd them out.
Usage analytics
The Usage dashboard and GET /api/logs/usage-stats aggregate:
- Summary: total cost, requests, input/output tokens, success rate, average response time, average TTFT, average tokens/second, cache creation/read tokens, cache savings.
- Breakdowns by provider and by model, plus a daily series.
Metrics come from the dedicated usage_records table, which is pruned on the same retention window as the logs and survives the manual Cleanup Logs action; request counts and success rate come from request_logs when available. Budget windows, the per-key spend figures, and the per-key usage view include judge usage records — a routing-judge call is billed on the key whose request triggered it, so it appears in that key's by-model breakdown. The global Usage dashboard and the Logs request counters stay endpoint-only, because a judge call is not a request the client made. Averages are the only latency/throughput statistics reported — no percentiles. Cache savings require a cached_read_cost_per_1m price on the model; without it the metric is skipped with a warning.
Audit Logs
Administrative and security events (logins, member and key management, provider key reveals, and every non-/v1/ admin operation) are written to a hash-chained audit log — each row's hash includes the previous row's, so removing or editing history is detectable.
- Chain:
content_hash= SHA-256 over a canonical JSON dump of the event, outcome, resource, model/provider, cost, tokens, and bodies. The stored link hash is SHA-256 of"{sequence}:{content_hash}:{previous_hash}", withGENESISas the seed of the chain. - Verify: Logs → Audit Logs → Verify Integrity (
GET /api/logs/audit/verify-integrity, admin only, optional sequence range) recomputes every hash and checks the linkage, returningvalid,verified_count, and any errors.
Audit rows are admin-only in the console and API.
MCP Calls, Web Search and Judge Calls tabs
| Tab | Contents |
|---|---|
| MCP Calls | One row per MCP operation: server, operation, resource type/name, arguments and result summary (masked), status, duration |
| Web Search | One row per intercepted search: query, provider, status, result count, max uses vs. current use |
| Judge Calls | One row per routing-judge call (log type judge): judge model, provider, resolved upstream model, tokens, cost and its source, status, duration, plus gate, shadow flag, verdict and error in metadata. Attributed to the request that triggered the call, which is named as parent_request_id |
A judge row is written before its parent request is served, so a call is still accounted for when the parent later fails. Its request id is the parent's with a :judge suffix. Bodies are never stored on these rows: the input is a bounded excerpt the parent row already holds, and the output is the verdict in metadata.
Tracing
Tracing is per user (Settings → General → Tracing) and currently supports Langfuse plus the always-on internal audit handler. There is no global tracing configuration and no OTLP exporter in v0.2.3.
When enabled, each request exports one generation observation:
- Name and model from the request, with model parameters.
input= messages (or{tools, messages}when tools are present);output= the assistant message with tool calls separated out.usage_detailsas mutually exclusive buckets:input/outputexclude the cache, audio and reasoning detail counts, which are emitted under their own buckets (cache_read_input_tokens,cache_creation_input_tokens,input_audio_tokens,output_audio_tokens,output_reasoning_tokens) so Langfuse's inferred cost does not double-count them.cost_details.totalis the proxy-computed (or provider-reported) USD total.- A
toolobservation per tool call the model requested. - Trace-level attributes via
propagate_attributes: trace name, user id and session id. Metadata carries the request id, trace id, provider, endpoint, latency, TTFT, token details not used as buckets, cache savings, and fallback/retry information.
Correlate a trace with a request by sending x-langfuse-trace-id (or x-trace-id); when it is a canonical 32-character hex Langfuse trace id the proxy's generation is nested inside that trace, otherwise the proxy starts its own trace. The proxy echoes a trace id header on responses and both headers are CORS-exposed. A generated trace id is also a 32-character hex id, so the trace_id in the request logs matches the Langfuse trace id exactly.
Related
- Settings — retention, masking, sampling
- Cost Control — turning usage data into budgets